
 Search
Learning | Foundations of Energy Risk
What is Value at Risk (VaR)?
Introductory Summary
Risk managers are often asked a deceptively simple question:
“How much could we lose?”
Value at Risk (VaR) is one of the most widely used approaches for answering that question. It provides an estimate of the potential loss a portfolio could experience over a specified period under normal market conditions.
In energy and commodity markets, VaR is commonly used to assess market risk across trading portfolios, physical assets, and structured contracts. It provides a consistent framework for comparing risk across different activities and reporting exposure to management.
Definition
Value at Risk (VaR) is a statistical measure that estimates the potential loss of a portfolio over a defined time horizon at a specified confidence level.
For example, a one-day VaR of $1 million at a 95% confidence level suggests that, under normal market conditions, losses are not expected to exceed $1 million on approximately 19 out of 20 trading days.
VaR does not predict what will happen. Rather, it provides an estimate of the range of losses that could reasonably occur based on historical behaviour and model assumptions.
VaR is commonly used to:
- monitor portfolio risk
- assess trading exposure
- support risk limits
- analyse market sensitivity
- compare exposure across portfolios
What Question Does VaR Answer?
At its core, VaR is designed to answer:
“What is the maximum loss we might reasonably expect over a given period?”
This makes VaR particularly useful for:
- daily risk monitoring
- portfolio comparisons
- risk limit frameworks
- management reporting
- regulatory and governance processes
By expressing risk as a single number, VaR allows participants to communicate complex portfolio exposures in a consistent and understandable way.
Why VaR Can Be Challenging in Energy Markets
Energy portfolios are often more complex than traditional financial portfolios. A portfolio may contain:
- physical supply contracts
- generation assets
- storage positions
- transportation agreements
- derivative instruments
Many of these exposures are influenced by factors that extend beyond simple price movements.
Power markets, for example, can experience sudden price spikes, negative prices, transmission constraints, and weather-driven volatility. Gas and LNG portfolios may be affected by infrastructure outages, seasonal demand shifts, or regional market dislocations.
As a result, computing VaR on energy portfolios requires careful consideration of market structure and portfolio characteristics.
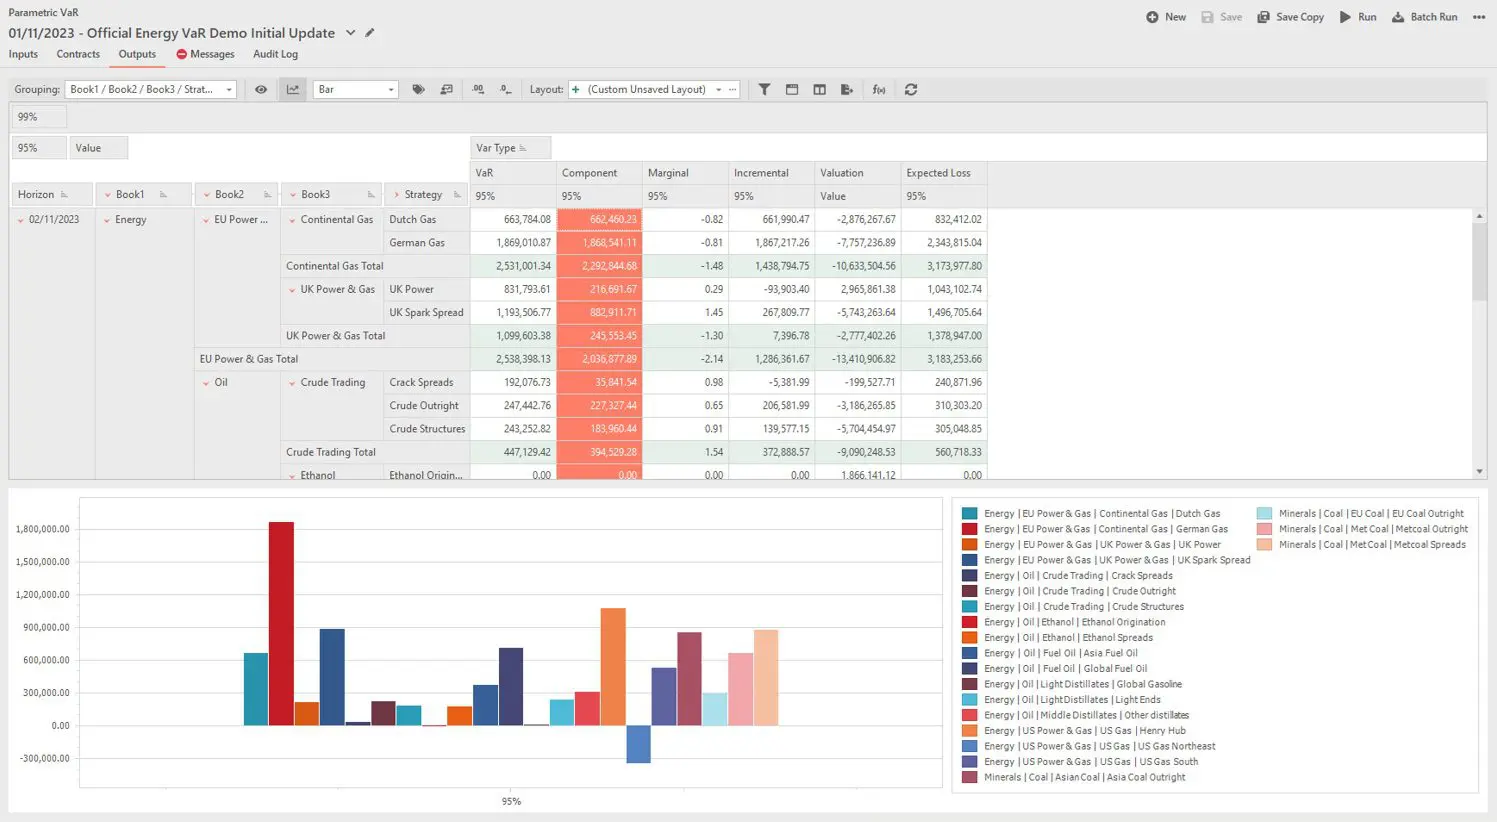
Screen from Lacima Analytics depicting how individual strategies within each trading book contributes to the total VaR of that book.
Key Components of VaR Analysis
Time Horizon
VaR is calculated over a specified time horizon, commonly ranging from one day to several weeks, depending on portfolio characteristics, liquidity, trading activity, and risk management objectives.
Confidence Level
VaR calculations typically use confidence levels such as 95% (5% tail) or 99% (1% tail). Higher confidence levels are used to estimate the size of larger potential loss thresholds which are more unlikely to occur.
Market Data & Volatility
In energy markets, changing volatility and market regimes can materially affect results. As such, VaR calculations rely on assumptions regarding:
- historical price behaviour
- market volatility
- correlations
- forward curve movements
Portfolio Composition
Portfolio structure significantly influences VaR outcomes. Energy portfolios may contain:
- outright commodity exposure
- spread positions
- physical assets
- options and structured contracts
These exposures may behave differently under stressed market conditions.
What VaR Doesn’t Tell You
One of the most common misconceptions is that VaR represents a worst-case loss – it does not.
VaR provides an estimate of losses within a chosen confidence range, but it does not describe what happens beyond that threshold. This is why VaR is often used alongside:
Together, these measures provide a more complete view of risk.
How Participants Use VaR
In practice, VaR is frequently embedded within broader risk management frameworks. Participants use VaR to:
- monitor portfolio risk levels
- compare risk across business units
- establish trading limits
- evaluate hedging effectiveness
- support governance and board reporting
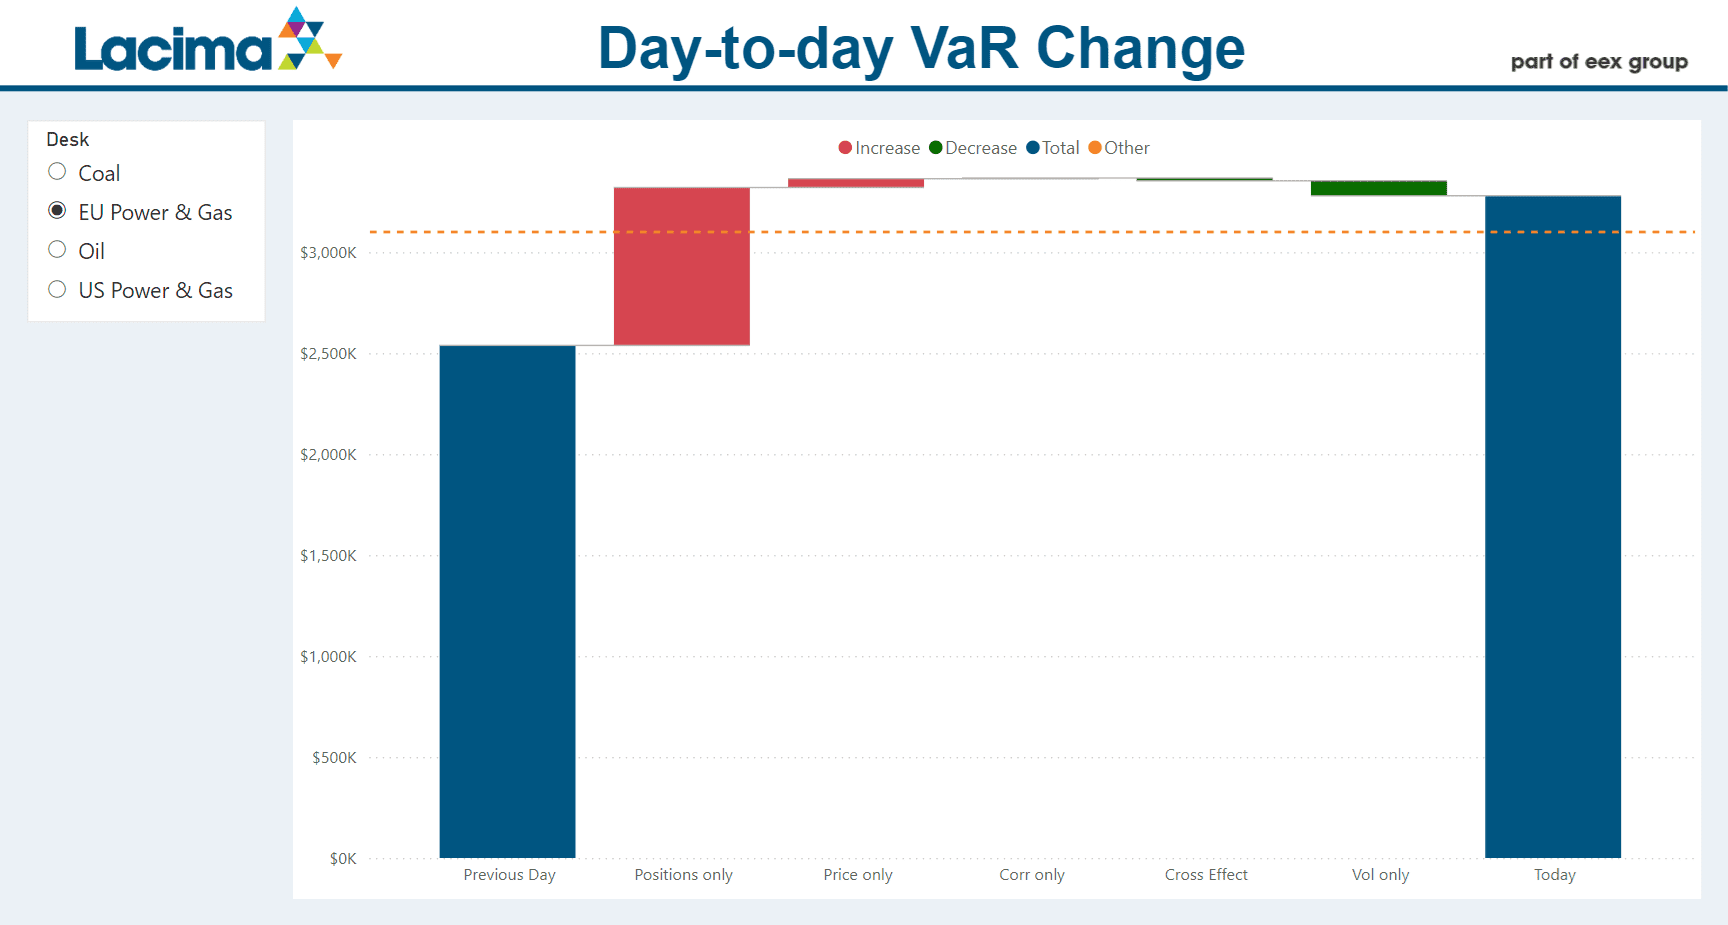
As portfolios grow in size and complexity, VaR calculations increasingly rely on integrated risk systems capable of consistently valuing positions, aggregating exposures, and analysing risk across multiple commodities and markets.
For example, Lacima Analytics > VaR supports the calculation and analysis of market risk across energy and commodity portfolios.
One-Sentence Takeaway
Value at Risk (VaR) estimates the potential loss a portfolio could experience over a specified time horizon and confidence level, providing a consistent measure of market risk but not a worst-case outcome.
Related Learning Resources
What is Energy Risk Management?
Learn how participants identify and manage exposure across energy and commodity portfolios.
Explore how stress testing is used to analyse portfolio behaviour under extreme market scenarios.
Understand how scenario analysis is used to assess the impact of changing market conditions on portfolios.
What is Monte Carlo simulation?
Learn how simulation techniques are used to model uncertainty and complex exposure profiles in energy markets.
While reasonable care has been taken in preparing this information, we make no warranties or representations as to its completeness, currency or accuracy. To the extent permitted by law, Lacima accepts no liability for any loss, damage or outcome arising from its use or reliance. Use of this article is subject to the full Terms and Conditions of this website.