
 Search
Learning | Quantitative Modelling Concepts
What is a Volatility Function?
Introductory Summary
Volatility is one of the most important inputs in quantitative energy modelling. It influences option values, risk measures, simulation results, and many investment decisions. Yet one assumption often made in simpler models is that volatility remains constant throughout the life of the simulation.
In reality, markets rarely behave this way.
Volatility can vary through time, and different forward maturities can exhibit different levels of volatility. In energy and commodity markets, the uncertainty associated with a short-dated forward can therefore differ from that of a longer-dated forward, while seasonal conditions can also affect the level of volatility observed across the forward curve.
Rather than assuming market uncertainty remains fixed, a volatility function provides a way to represent how volatility varies with time and maturity. This more general model can produce simulations that better reflect the behaviour observed in real energy and commodity markets.
Definition
A volatility function is a modelling function that describes how the volatility of a market variable varies according to factors such as calendar time and the maturity of the forward contract.
In a forward-curve model, the volatility can therefore be represented as a function of both the current time and the delivery maturity. This allows different points on the forward curve to have different levels of modelled uncertainty rather than applying one volatility assumption to every maturity and enables simulations to represent different levels of uncertainty across time and maturity.
This is distinct from stochastic volatility. A volatility function may be a deterministic component of a market model that specifies how volatility varies with time and maturity. A stochastic volatility model goes further by treating volatility itself as a random process that evolves through time.
Although volatility models with term structures are mathematically more sophisticated than constant volatility models, the underlying concept is straightforward: markets experience changing levels of uncertainty, and models should be capable of reflecting that behaviour.
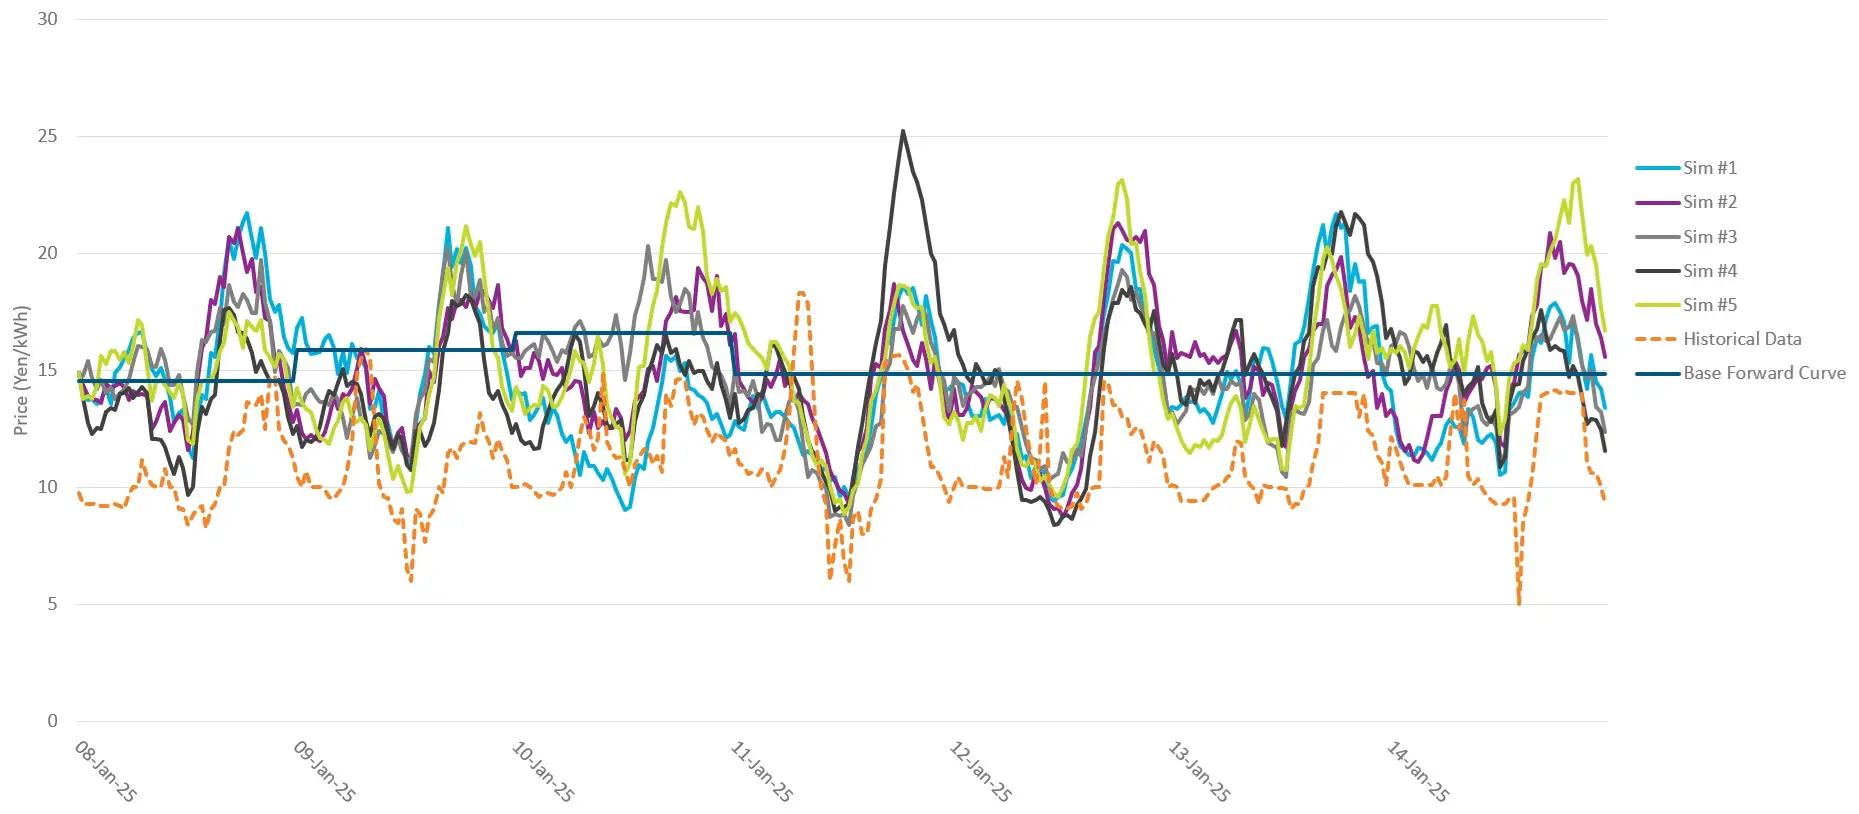
Volatility Functions Produce More Realistic Simulations
Many valuation and risk models generate simulated future price paths rather than attempting to predict a single future outcome. The usefulness of those simulations depends on how realistically they represent market behaviour.
Simpler models often assume that volatility remains constant throughout the analysis. While this assumption makes the mathematics more straightforward, it means every stage of the simulation exhibits broadly the same level of uncertainty.
Energy and commodity markets rarely behave this way.
Market uncertainty changes continually as new information becomes available. Weather events, supply disruptions, geopolitical developments, regulatory changes, and shifts in demand can all alter not only prices, but also the uncertainty surrounding future prices.
Models that incorporate volatility functions allow simulations to reflect these changing market conditions by allowing volatility itself to change through time.
This often produces simulated price paths that more closely resemble observed market behaviour, particularly for assets whose value depends on future price uncertainty, including energy options, storage facilities, and other contracts with embedded optionality. More realistic simulations can, in turn, lead to more robust valuation and risk analysis.
Volatility Function and Mean Reversion
In the ‘What is Mean Reversion?’ article, we explored how mean reversion influences the direction in which prices tend to evolve over time.
These two concepts are closely related, but they describe different aspects of market behaviour.
Mean reversion describes the tendency of prices to move towards a longer-term level, while a volatility function describes how the uncertainty around those price movements varies across time and maturity.
In a simple mean-reverting model, mean reversion can also produce a term structure in forward-price volatility. The impact of short-term spot-price movements becomes progressively attenuated for forwards with longer maturities as the mean reversion process acts over time.
This means that the volatility behaviour observed across the forward curve can arise partly from the assumed price dynamics themselves, rather than having to be treated as an unrelated input.
Together, mean reversion and an appropriate volatility function can provide a more realistic representation of energy price behaviour than assuming both price dynamics and volatility are uniform through time.
Volatility Functions and Seasonality
Energy markets are strongly influenced by seasonal patterns, and volatility can exhibit seasonality as well. A volatility function can therefore be constructed to reflect recurring differences in uncertainty between different periods of the year.
In more advanced multi-factor models, time-dependent and maturity-dependent volatility components can be combined to represent both seasonal effects and the way different sources of uncertainty affect different parts of the forward curve.
This can be particularly important in markets where uncertainty is materially different between seasons or delivery periods.
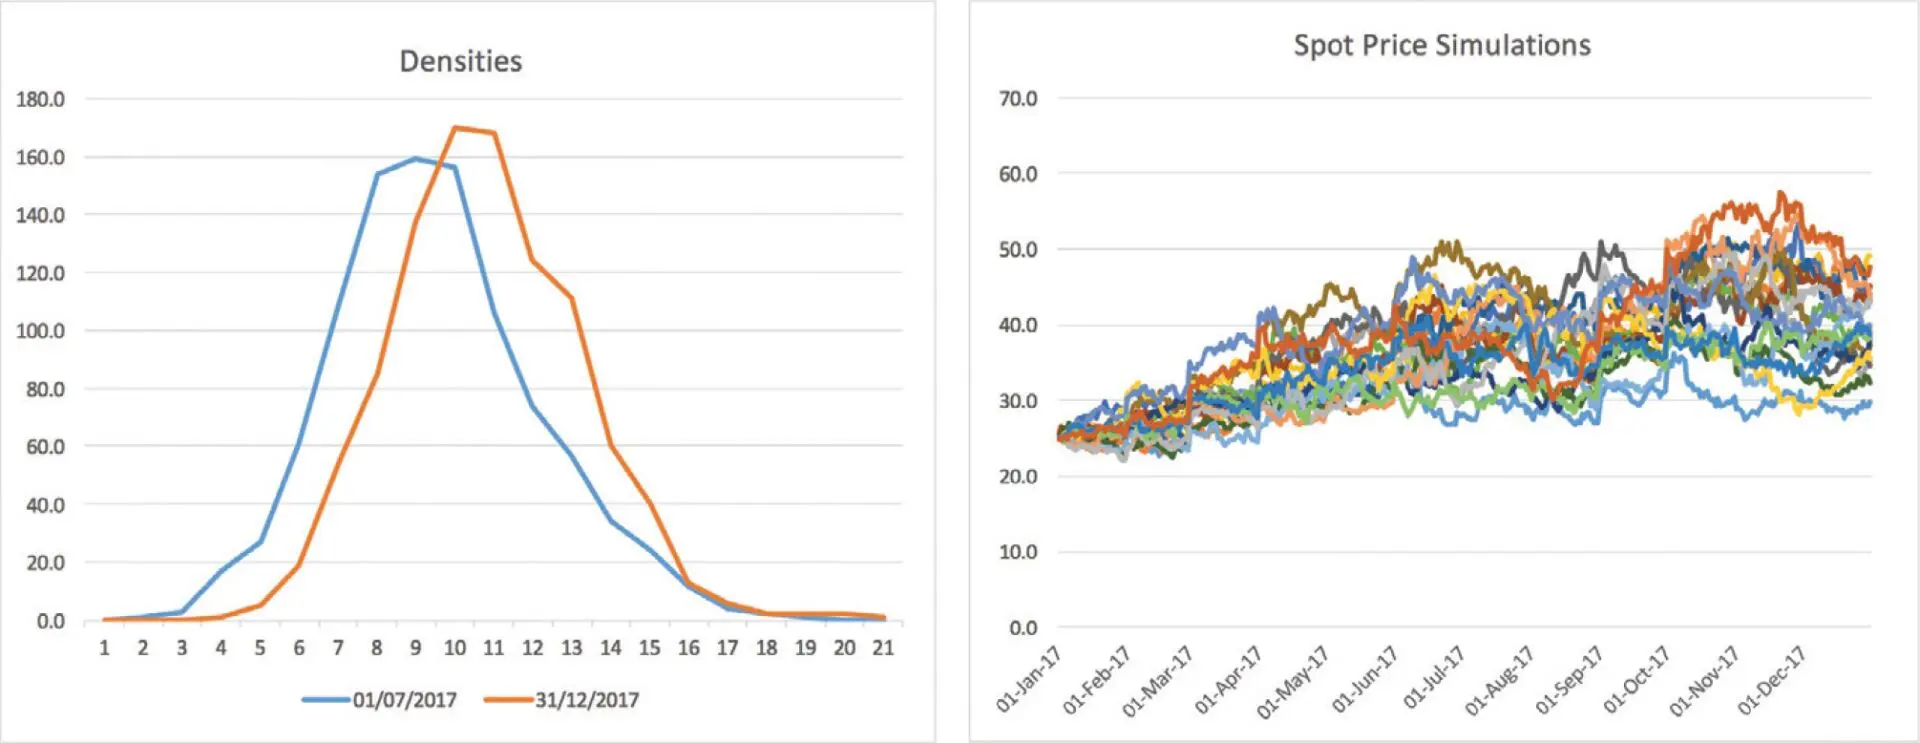
‘Volatility Function’ and ‘Volatility Surface’ Are Not the Same Thing
The terms ‘volatility function’ and ‘volatility surface’ are related but describe different modelling concepts.
A volatility function in a forward-curve model describes how volatility varies with dimensions such as time and forward maturity. A volatility surface is typically associated with option markets and describes implied volatility across dimensions such as option maturity and strike or moneyness.
The two can be used together. A market model may use volatility functions to represent the evolution of the underlying forward curve while option-market information is used to calibrate or constrain volatility assumptions.
Common Pitfalls and Misconceptions
Volatility Functions Predict Market Crashes
No, a volatility function does not predict when volatility will increase, or when a market event will occur. It simply allows the model to represent changing levels of uncertainty if they occur. Unexpected events remain inherently uncertain.
One Volatility Number Is Sufficient
Not always. Applying a single volatility assumption across all forward maturities can overlook important differences in the behaviour of different delivery periods. A volatility function allows these differences to be represented explicitly.
More Complex Models Are Always Better
Not necessarily. More sophisticated models require additional calibration, market data, and governance. The most appropriate model depends on the purpose of the analysis, the available data, and the characteristics of the market being modelled.
How Volatility Functions Are Applied in Practice
Volatility functions become particularly important where valuation depends on future uncertainty that cannot be directly observed from a traded instrument.
For standardised financial options that are actively traded, market prices can provide an observable basis for estimating implied volatility. However, the embedded optionality in physical assets such as gas storage may not be directly observable in an options market.
Instead, advanced models that incorporate volatility term structures are needed and must be carefully calibrated using appropriate historical and market-observable data. Monte Carlo simulations together with optimisation can then be employed together to estimate the value of the optionality.
Rather than managing volatility functions in isolation, many organisations implement integrated analytics platforms that enable a common market model to be used consistently across calibration, simulation, valuation, optimisation, and risk analysis. Applications such as Lacima Analytics help practitioners do this efficiently and within a single analytical environment, providing the consistency, transparency, governance, and auditability expected across enterprise risk management.
One-Sentence Takeaway
A volatility function describes how market volatility varies across time and maturity, allowing energy market models to represent the term structure and seasonal behaviour of uncertainty more realistically for simulation, valuation and risk analysis.
Related Learning Resources
Learn how many energy and commodity prices exhibit a tendency to move back towards longer-term equilibrium levels and why this behaviour is widely incorporated into simulation models.
What is Volatility Surface Calibration?
Discover how observable option prices are used to calibrate volatility assumptions for valuation and risk analysis.
Explore how stochastic models represent uncertain future market behaviour across valuation, simulation, and risk management applications.
What is Monte Carlo simulation?
See how thousands of simulated future price paths are generated to value assets and quantify market risk under uncertainty.
While reasonable care has been taken in preparing this information, we make no warranties or representations as to its completeness, currency or accuracy. To the extent permitted by law, Lacima accepts no liability for any loss, damage or outcome arising from its use or reliance. Use of this article is subject to the full Terms and Conditions of this website.