
 Search
Learning | Valuation & Pricing Analytics
How to Shape a Forward Curve
Introductory Summary
Forward curves provide a market-consistent view of future prices, but rarely contain enough detail for practical analysis.
For example, an electricity market may provide monthly, quarterly, peak, and off-peak forward prices, while a gas market may provide seasonal or monthly contracts. Yet analysts often need prices at a much finer level of granularity to support simulation, optimisation, asset valuation, and risk analytics.
Forward curve shaping bridges this gap. It takes a completed forward curve and applies realistic pricing profiles that reflect how markets tend to behave across seasons, days, and settlement periods, while preserving the value implied by observable market prices.
Objective of Forward Curve Shaping
The purpose of shaping a forward curve is straightforward:
“To introduce realistic structure without changing the economics implied by quoted market prices.”
The resulting profile should:
- reflect known market behaviour;
- support more detailed analysis;
- preserve consistency with observable market prices; and
- remain suitable for valuation and risk calculations.
In effect, shaping bridges the gap between tradable market products and the level of detail required for operational and analytical decision-making.
Why Granularity Matters
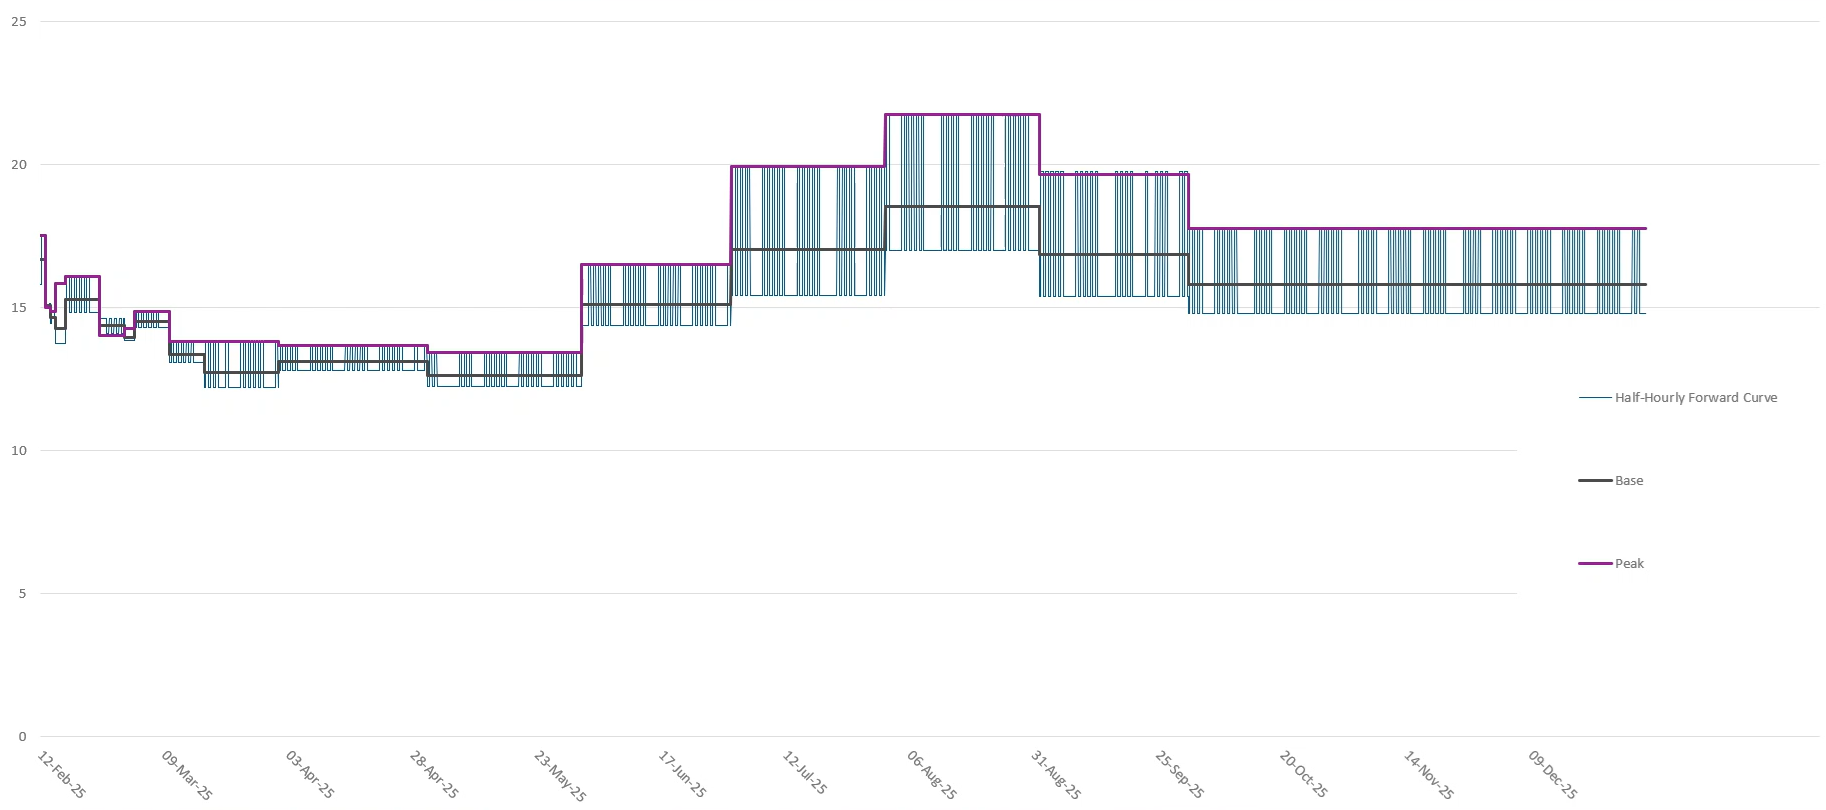
A monthly average price may be sufficient for high-level reporting, but it often lacks the detail required for more advanced valuation and risk applications. Many energy assets and contracts respond to prices at a much finer level than the products traded in forward markets.
For example:
- power generation assets may require hourly or sub-hourly prices;
- batteries may capture value from short-term price movements;
- gas storage decisions may depend on daily market dynamics;
- structured contracts may contain operational flexibility linked to specific delivery periods; and
- simulation models often require detailed price paths.
Inputs Required
Forward curve shaping typically begins with:
- a completed and validated forward curve;
- historical spot market prices;
- market calendars;
- peak and off-peak definitions;
- settlement interval definitions; and
- profiling assumptions.
Historical spot prices are particularly important because they provide evidence of how prices have behaved across different market conditions.
In power markets, historical spot price behaviour is often used to identify recurring intraday and seasonal relationships that can be applied to forward prices.
Methodology: Conceptual Steps
Step 1: Gather Observable Market Prices
The process begins with the forward products that are actively traded and observable in the market.
Examples may include:
- monthly forwards;
- quarterly strips;
- annual contracts;
- base-load products;
- peak products; and
- off-peak products.
These observable prices provide the market foundation for the curve.
Step 2: Infer Missing Periods Where Necessary
In many energy and commodity markets, observable market quotes do not provide complete coverage of every delivery period required for analysis.
For example, market participants may observe a quoted quarterly contract together with prices for the first two months, but with no data available for the remaining month.
In these situations, shaping and curve-construction techniques are used to infer prices for the missing delivery periods while preserving consistency with observed market prices.
Similarly, quoted base-load and peak products can be used to infer the corresponding off-peak values needed to complete the curve.
The objective is not to create new market views, but to ensure the resulting forward curve remains economically consistent with observable prices.
Step 3: Expand the Curve to the Required Granularity
This article assumes that forward curve construction has already been completed and that the resulting curve is internally consistent with observable market prices.
Depending on the application, this may involve:
- Daily values;
- Intervals at hourly granularity or less;
- other market-specific time structures.
At this stage, each interval initially inherits the value of the broader product from which it was derived.
The curve now contains the required number of data points, but still lacks realistic temporal structure.
Step 4: Develop Profiles from Historical Market Behaviour
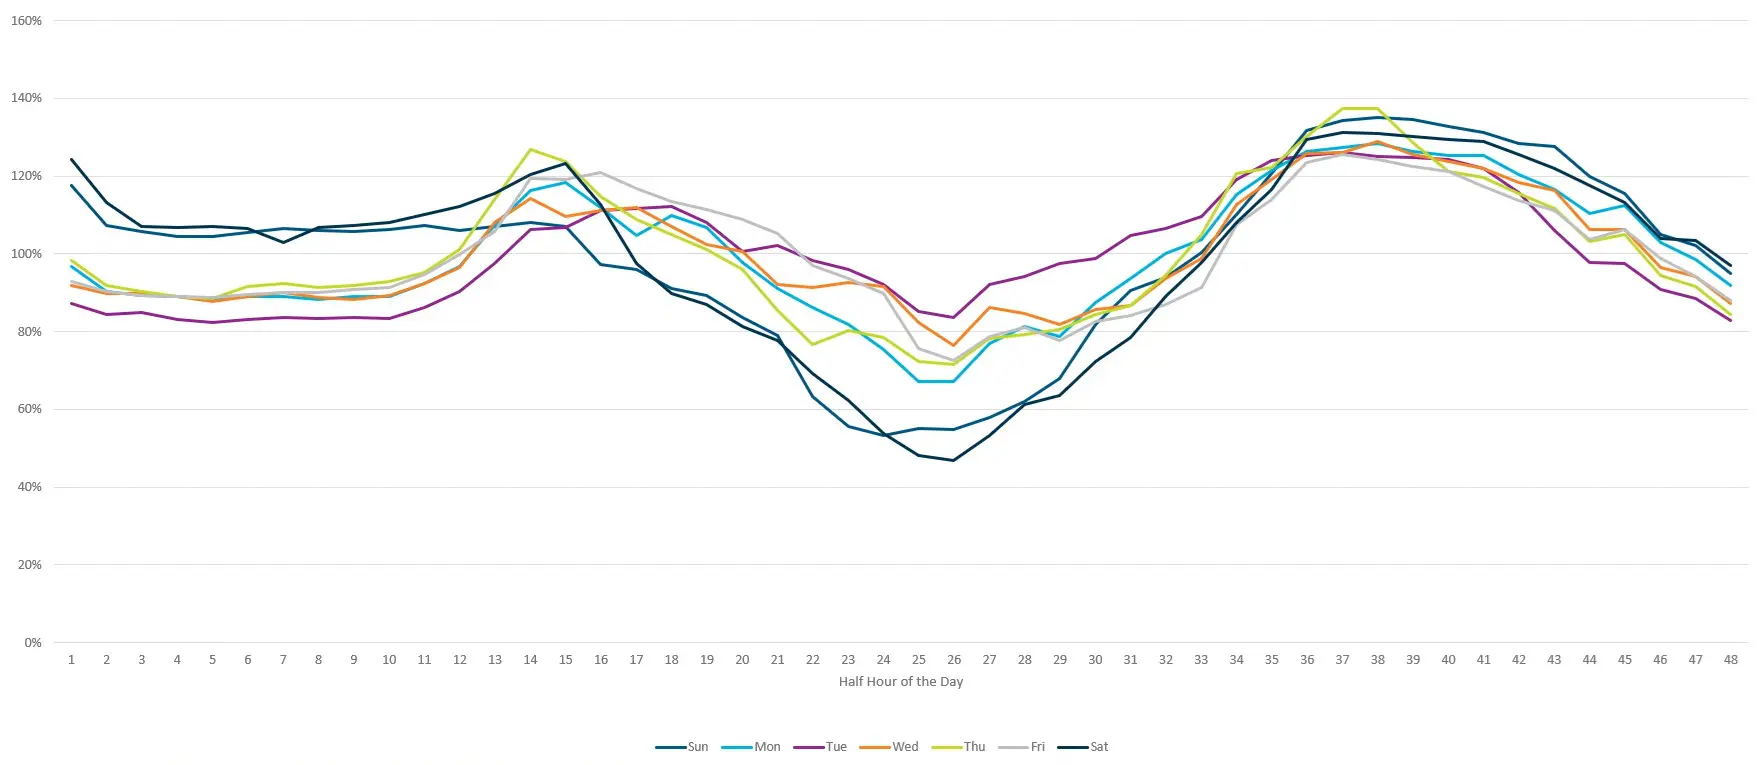
Historical spot prices are analysed to identify recurring patterns in market behaviour and develop profiles used to shape the forward curve. Depending on the market and intended use, profiles may be developed according to factors such as:
- season or quarter;
- weekday versus weekend periods;
- peak and off-peak definitions;
- time of day; and
- other market-specific characteristics.
The objective is to understand how individual periods typically behave relative to the average price within a broader delivery block.
One practical approach is to estimate how each interval tends to increase or decrease relative to the average price for the relevant period. For example, historical analysis may reveal that weekends exhibit distinct pricing patterns, or that electricity demand produces morning and evening peaks separated by lower-priced periods during the middle of the day.
The resulting profiles describe how individual settlement periods tend to deviate from the average, introducing realistic market structure while preserving the overall economics of the forward contract.
These profiles provide the realism required by many valuation, forecasting and simulation models.
Step 5: Shape the Curve Using the Profiles
The derived profiles are then applied to the expanded forward curve. Higher-priced periods receive relatively larger adjustments while lower-priced periods receive relatively smaller adjustments. The result is a profiled curve that more closely resembles how the market typically behaves while remaining anchored to current market prices.
Step 6: Reconcile Back to Market Prices
This is arguably the most important step in the process – the average values of the shaped curve must reconcile back to the original quoted products. A shaped curve is only useful if it remains consistent with the forward market from which it was derived.
Validation checks should confirm that:
- all quoted market products can be reproduced from the shaped curve;
- peak and off-peak relationships remain intact;
- profile adjustments have not altered market value; and
- no distortions have been introduced during the shaping process.
For example:
- hourly values within a monthly peak contract should average back to the quoted peak price;
- off-peak intervals should reconcile to the observable off-peak economics; and
- inferred periods should preserve the relationships implied by the market.
This principle is fundamental. Shaping should introduce structure and realism without changing the economics implied by the market.
Why Profiling Matters
Forward curve shaping is not merely about producing more detailed charts – granular pricing profiles underpin many of the analyses used by commercial and risk teams.
Detailed profiles often provide more realistic inputs for:
- Monte Carlo simulation;
- physical asset valuation;
- generation dispatch analysis;
- battery optimisation;
- storage valuation;
- structured contract valuation; and
- portfolio risk modelling.
Without realistic shaping assumptions, organisations may struggle to accurately represent how assets and contracts behave in practice.
Common Pitfalls and Misconceptions
Historical Patterns Don’t Change
Market behaviour evolves over time. Profiling methodologies should be reviewed periodically to ensure they remain representative.
More Detail Always Means More Accuracy
Additional granularity is only valuable when supported by reasonable assumptions and reliable historical data.
Profiling Creates New Market Information
Shaping does not create new market views. Its purpose is to distribute existing market value across more detailed delivery periods while preserving consistency with observable prices.
How Forward Curve Shaping is Addressed in Practice
Developing and maintaining profiled forward curves can become challenging as markets, commodities, and valuation requirements become more complex.
Many organisations therefore implement formal profiling methodologies supported by governance controls, historical data management, reconciliation testing, and version-controlled assumptions.
Integrated analytics applications such as Lacima Analytics help automate these processes and ensure that shaped curves remain consistent across valuation, simulation, optimisation, and risk applications.
One-Sentence Takeaway
Forward curve shaping builds upon a completed forward curve, transforming market-consistent prices into realistic pricing profiles that support more accurate valuation, simulation, optimisation, and risk analysis.
Related Learning Resources
Understand how forward curves support valuation, hedging, and risk management across energy portfolios.
How to Build an Energy Forward Curve
Learn how to construct forward curves from observable market products and market conventions.
What is an Energy Trading and Risk Management (ETRM) System?
Understand what ETRM systems do, where their limitations lie, and why organisations complement them with specialist valuation and risk analytics.
What is Monte Carlo simulation?
Discover why profiled forward curves are often used as inputs into simulation-based analytics.