
 Search
Learning | Valuation & Pricing Analytics
How to Build an Energy Forward Curve
Introductory Summary
A forward curve provides the market foundation for valuation and risk management. However, unlike the smooth curves often displayed in trading and analytics systems, market participants do not usually observe a complete set of prices for every future delivery period.
Instead, markets typically provide a collection of tradable products covering different time horizons and delivery structures. Monthly contracts, quarterly strips, annual products, peak contracts, and off-peak products may all coexist, often overlapping with one another.
Building an energy forward curve is the process of transforming those observable market prices into a complete and internally consistent representation of future market values.
Objective of Forward Curve Construction
The resulting curve can then support:
- Mark-to-Market valuation;
- portfolio exposure measurement;
- hedge effectiveness analysis;
- physical asset valuation;
- commercial planning;
- scenario analysis; and
- risk reporting.
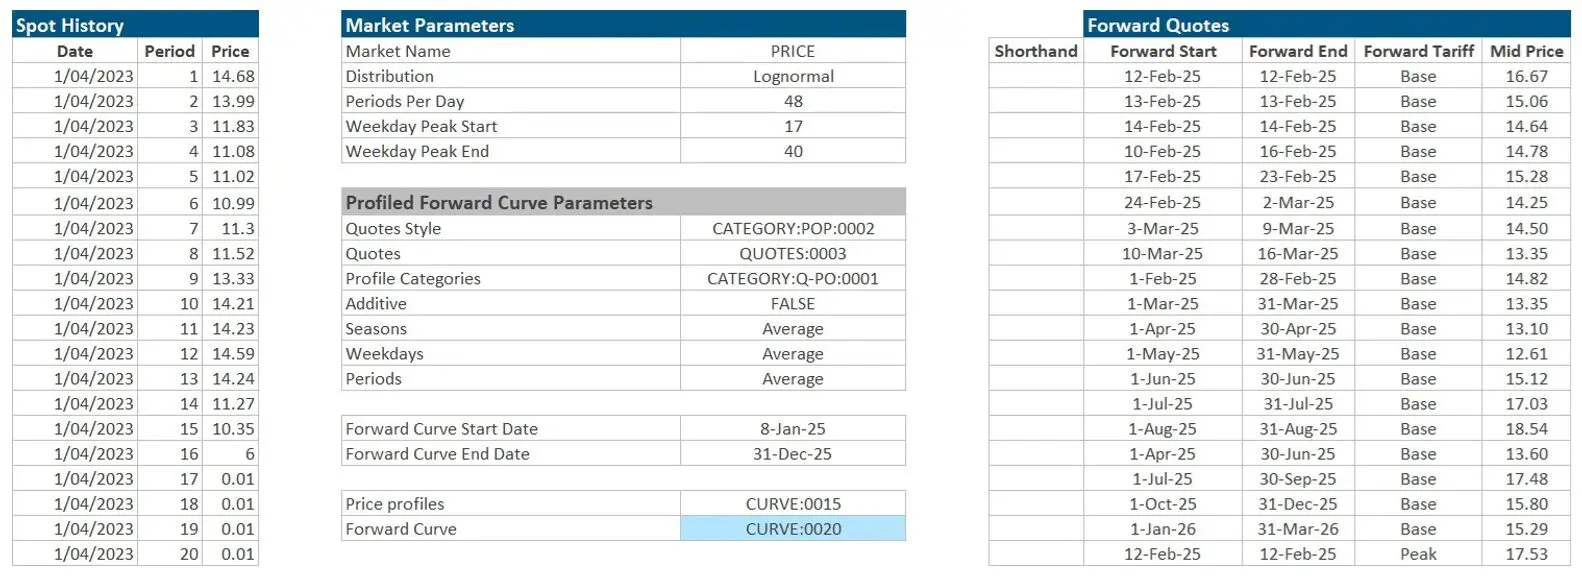
Importantly, the objective is not to forecast future spot prices. The purpose is to represent today’s market view in a form that can be applied consistently across an organisation.
Forward Curve Construction is an Exercise in Consistency
One of the defining characteristics of energy markets is that multiple products often describe overlapping periods of time. For example, a market may simultaneously provide:
- a calendar-year contract;
- quarterly contracts;
- monthly contracts; and
- peak and off-peak products.
All of these contracts contain information about future market pricing, but they must collectively tell the same story. A well-constructed forward curve ensures that all observable products remain economically consistent with one another.
This principle sits at the heart of forward curve construction.
Inputs Required
The specific inputs vary by commodity and market, but commonly include:
- quoted forward and futures prices;
- contract specifications;
- delivery calendars;
- settlement conventions;
- peak and off-peak definitions;
- holiday schedules; and
- curve construction assumptions.
For electricity markets, additional inputs may include separate base-load, peak, and off-peak products. Gas markets may involve seasonal contracts, monthly strips, or transportation-specific structures.
Methodology: Conceptual Steps
Step 1: Gather Observable Market Quotes
The process begins by collecting available market quotes. Examples include:
- monthly forwards;
- quarterly strips;
- seasonal contracts;
- annual strips;
- base-load contracts;
- peak contracts; and
- off-peak products.
Where multiple prices are available, practitioners generally prioritise the most liquid and reliable market observations.
Step 2: Map Products to Delivery Periods
Each market product represents a different slice of future market exposure. For example, markets may trade annual, quarterly, monthly, peak, or off-peak products, each covering different delivery periods or operating profiles.
These products are all describing the same underlying market, just at different levels of granularity or contract maturity.
This step establishes how different products relate to one another. Understanding these relationships is essential before a complete curve can be constructed.
Step 3: Resolve Overlapping Products
Energy markets frequently contain multiple products that overlap in time and delivery structure. A practitioner may observe:
- a calendar-year price;
- quarterly prices;
- monthly prices within a quarter; or
- peak and base-load contracts covering the same periods.
These products cannot simply be layered on top of one another – they need to be reconciled so that the resulting curve remains consistent across all observable prices.
For example, if the market provides a quarterly quote and prices for the first two months of that quarter, the remaining month may be inferred so that the three months collectively average back to the quoted quarterly value.
Similarly, off-peak prices may be inferred from observable base-load and peak products.
The objective is not to introduce new market views, but to preserve the economics implied by the prices that are actually traded.
Step 4: Populate the Curve
Once all observable products have been reconciled, prices can be assigned across the required delivery horizon.
The resulting curve should:
- cover all required periods;
- avoid gaps;
- preserve observable market relationships; and
- remain internally consistent.
At this stage, the objective is simply to establish a complete forward curve covering all required delivery periods. Where more detailed operational analysis is required, the completed curve is typically shaped into finer pricing profiles while preserving the economics of the underlying market products.
See the next article on How to Shape a Forward Curve for more information on profiling a curve once you’ve built it.
Step 5: Validate the Results
Validation is a critical part of curve construction.
Checks commonly include confirming that:
- all quoted market products can be reproduced from the resulting curve;
- relationships between overlapping contracts remain consistent;
- peak and off-peak structures remain intact;
- inferred delivery periods behave reasonably; and
- no distortions have been introduced during the construction process.
These controls help ensure confidence in downstream valuation and risk calculations.
Why Forward Curve Construction Matters
Forward curves underpin many of the most important analytical processes in energy markets.
Without robust forward curves, organisations may struggle to:
- value contracts consistently;
- aggregate portfolio exposures accurately;
- assess hedge performance;
- compare commercial alternatives;
- simulate future outcomes; or
- evaluate physical asset and investment decisions.
As a result, the quality of the forward curve can significantly influence the quality of the decisions built upon it.
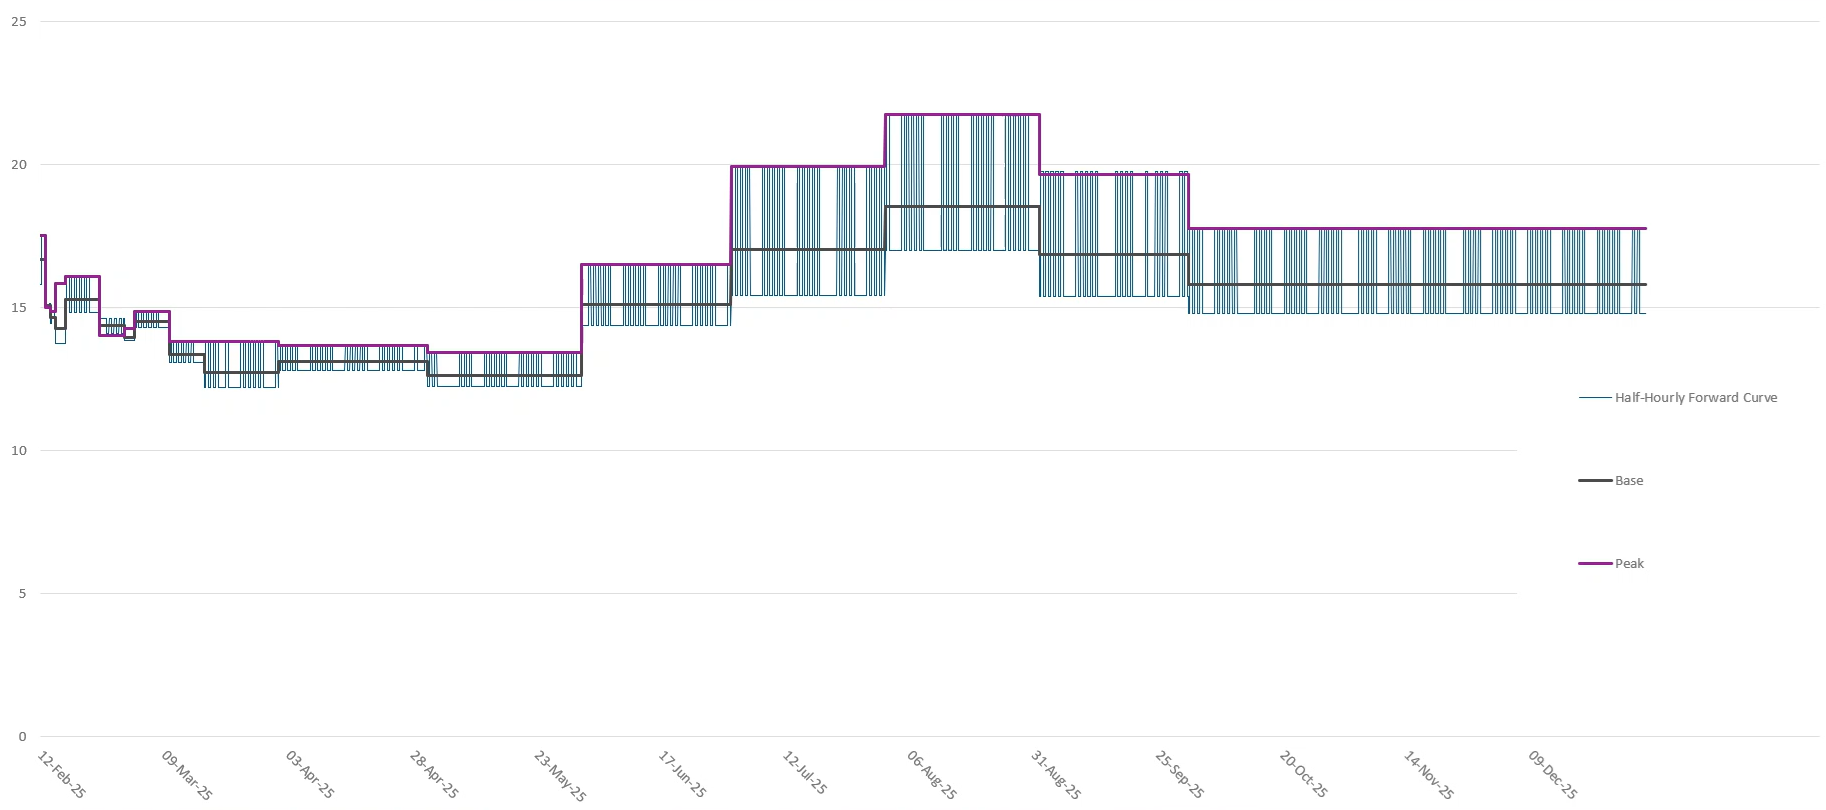
Common Pitfalls and Misconceptions
More Data Automatically Produces Better Curves
Additional market quotes can improve precision, but they may also introduce inconsistencies. Curve quality depends not only on the amount of data available, but also on how effectively that information is reconciled.
Observable Prices Should Be Used Without Adjustment
Market products frequently overlap and cannot simply be stacked together. Consistency checks and reconciliation are necessary to ensure all products remain economically aligned.
Curve Construction Is a One-Off Exercise
Forward curves evolve continuously as markets move. Most organisations rebuild curves regularly to ensure valuation and risk analytics reflect current market conditions.
How Forward Curve Construction Is Addressed in Practice
While the principles of forward curve construction are straightforward, producing high-quality curves efficiently and reliably can be challenging in practice. Organisations often need to reconcile multiple market data sources, infer missing delivery periods, update curves as markets evolve, and maintain consistency across valuation and risk processes.
Although some organisations rely on spreadsheets and manual processes, these approaches can become increasingly difficult to manage as portfolios, markets, and stakeholders expand.
As a result, many practitioners choose to use integrated analytics platforms to support the construction, maintenance, and governance of forward curves. Applications such as Lacima Analytics and Lacima Trader help organisations manage forward curves as controlled enterprise data assets, improving consistency while reducing operational risk across trading, risk, finance, and commercial teams.
One-Sentence Takeaway
Building an energy forward curve is the process of translating observable market products into a complete and internally consistent representation of future prices that can support valuation, risk analysis, and decision-making.
Related Learning Resources
Understand what forward curves represent and why they underpin valuation and risk management activities.
Learn how to transform completed forward curves into detailed pricing profiles suitable for operational and simulation-based analysis.
What is Mark-to-Market (MtM) Valuation?
Explore how forward curves are used to determine the current value of contracts and portfolios.
What is Monte Carlo simulation?
Discover how forward curves provide foundational inputs into simulation-based valuation and risk analytics.