
 Search
Learning | Valuation & Pricing Analytics
What is Volatility Surface Calibration?
Introductory Summary
Forward curves describe the market’s current pricing of future delivery periods, but many energy contracts depend on more than expected prices alone. Their value also depends on the uncertainty surrounding those prices.
Volatility surface calibration is the process of translating observable option prices into a consistent representation of market-implied volatility. This calibrated volatility surface becomes a fundamental input for valuing options, modelling flexible assets, and measuring portfolio risk across energy and commodity markets.
Rather than asking “What prices does the market imply?”, volatility surface calibration asks:
“Where is the market pricing in risk?”
Options, storage assets, swing contracts, tolling agreements, and other flexible positions derive value not only from expected prices, but also from the uncertainty and potential variability of those prices.
Definition
Volatility surface calibration is the process of backing out the volatility implied by observable option prices traded in a market to be used within a consistent valuation model.
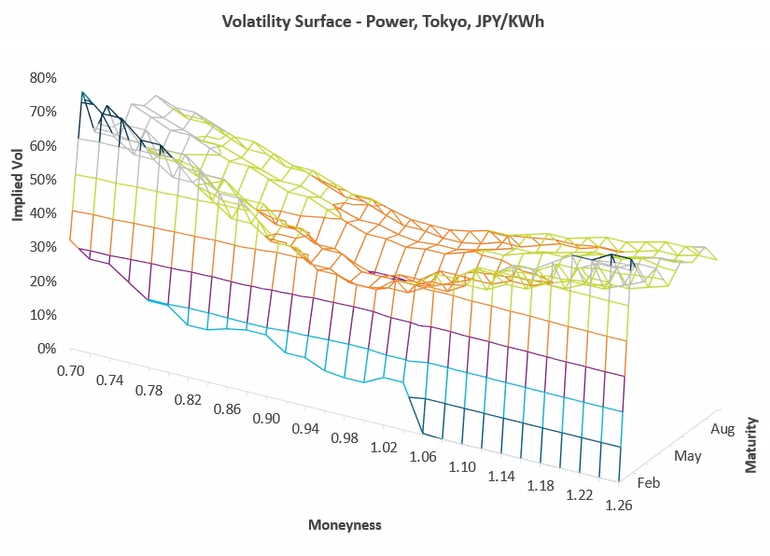
The result is a volatility surface (often shortened to a vol surface) that describes how implied volatility varies across different:
- option maturities;
- delivery periods; and
- option moneyness.
Rather than relying solely on historical price behaviour, calibrated volatility surfaces reflect how the market is currently pricing uncertainty.
Why Volatility Matters in Energy Markets
Many energy contracts contain optionality. For these instruments, value depends not only on where prices are expected to be, but also on how much they could move before the contract expires.
This is particularly important for:
- energy options and exotic derivatives;
- swing contracts;
- gas storage;
- tolling agreements;
- LNG flexibility;
- battery optimisation; and
- other assets with operational flexibility.
For contracts like these, uncertainty itself has economic value. Two contracts with identical forward prices may have very different values if the expected variability of future prices differs significantly.
As market uncertainty increases, the value of flexibility often increases as well. Representing volatility accurately is therefore a critical part of energy valuation and risk analysis.
Why Convert Prices into a Volatility Surface?
Option markets are typically quoted as prices rather than volatilities.
However, comparing option prices directly can be difficult because contracts often have different maturities, forward prices and strike prices.
By converting option prices into implied volatilities, practitioners create a standardised representation of market uncertainty that is much easier to analyse and maintain.
Rather than interpreting hundreds of individual option prices, traders and risk managers can work with a single volatility surface that captures how the market is pricing uncertainty across different contracts.
For many organisations, the volatility surface becomes the primary market data set used in option valuation rather than the original option prices themselves.
Understanding Moneyness
Volatility surfaces are commonly plotted against ‘moneyness’ rather than absolute strike prices.
Moneyness compares an option’s strike price with the current forward price for the underlying commodity.
Expressing options this way allows contracts with different forward prices to be compared on a consistent basis.
For example, two options may have very different strike prices simply because they relate to different delivery months. Using moneyness removes much of this variation, making it easier to identify how implied volatility changes across the market.
How Calibration Works
Volatility cannot usually be observed directly.
Conceptually, the process involves:
1. collecting observable option prices;
2. selecting an appropriate pricing model;
3. converting prices into implied volatilities;
4. constructing a volatility surface across maturities and moneyness; and
5. validating that the resulting surface remains consistent with observable market prices.
Rather than trying to predict future volatility, calibration ensures valuation models remain aligned with today’s market.
Insights a Volatility Surface Can Reveal
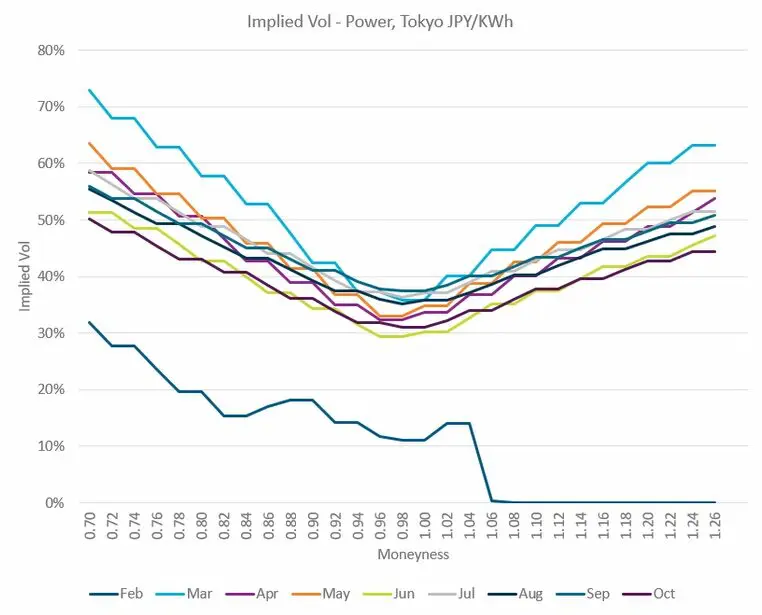
One advantage of working with a volatility surface rather than individual option prices is that market behaviour often becomes much easier to interpret.
For example, plotting the surface can quickly reveal:
- delivery months with relatively high implied volatility;
- differences between short and long-dated options;
- changing volatility patterns across maturities; and
- unusual regions of the market that may warrant further investigation.
Calibration Is About Consistency
The objective of calibration is not to discover the ‘true’ future volatility of the market. Instead, it is to ensure that valuation models remain consistent with observable market information by aligning:
- market prices;
- implied volatility inputs; and
- valuation outputs.
Without calibration, a model may produce valuations that differ materially from observable market prices. This can create inconsistencies across:
- valuation;
- hedging;
- risk measurement;
- stress testing; and
- portfolio reporting.
Calibration therefore helps establish a consistent analytical foundation across an organisation.
Common Pitfalls and Misconceptions
Every Point on a Volatility Surface Is Directly Observable
A common misconception is that every point on a volatility surface comes from an actively traded option.
In reality, only part of the surface is typically supported by observable market prices. Some combinations of strike price and maturity, particularly deep in-the-money or far out-of-the-money options, may trade infrequently or not at all.
To produce a complete and usable volatility surface, practitioners often interpolate between observable market data and apply appropriate modelling techniques where necessary.
The objective is to remain as faithful as possible to market evidence while constructing a smooth, internally consistent surface that can be used reliably for valuation and risk analysis.
Historical Volatility and Implied Volatility Are the Same
Historical volatility measures how prices moved in the past. Calibrated volatility surfaces typically represent implied volatility derived from current market prices. The two can differ significantly.
One Volatility Number Is Sufficient
Energy markets rarely behave this simply. Volatility often varies across both maturity and moneyness, making a complete surface considerably more representative than a single volatility assumption.
Calibration Is Performed Once
Volatility surfaces evolve continuously as option markets move. Professional organisations typically recalibrate their surfaces regularly to ensure valuation and risk analytics remain aligned with current market conditions.
How Volatility Surface Calibration Is Addressed in Practice
The objective of volatility surface calibration is not to predict the market’s future volatility with certainty. Rather, it is to ensure pricing models remain consistent with observable market prices so valuation and risk calculations are based on a common analytical foundation.
Maintaining that consistency can become increasingly challenging as organisations manage multiple option markets, evolving market conditions, sparse data, different maturities and strike prices, model assumptions, and governance requirements.
As a result, many practitioners use specialised analytics platforms to support calibration, helping maintain consistency, transparency, and auditability while ensuring volatility assumptions are applied consistently throughout valuation and risk processes.
Solutions such as Lacima Analytics and Lacima Trader can help to assist with that process.
One-Sentence Takeaway
Volatility surface calibration ensures that valuation and risk models represent uncertainty in a manner that remains consistent with current market option prices.
Related Learning Resources
What is an Energy Trading and Risk Management (ETRM) System?
Understand what ETRM systems do, where their limitations lie, and why organisations complement them with specialist valuation and risk analytics.
Understand how option values depend on both forward prices and volatility assumptions.
What is Monte Carlo simulation?
Explore how calibrated market assumptions are incorporated into simulation-based valuation and risk models.
Learn how stochastic models represent uncertainty and how calibrated market inputs are used within those models.