
 Search
Learning | Quantitative Modelling Concepts
What is Mean Reversion?
Introductory Summary
Energy prices can be extremely volatile. Electricity prices may spike several hundred percent (or at times, much more) within hours. Gas prices can respond sharply to weather or supply disruptions. Commodity markets frequently experience periods of significant uncertainty.
Despite this short-term volatility, prices do not typically continue moving in one direction indefinitely. As market conditions change, high (or low) prices generally move towards more typical long-term levels.
This tendency is known as ‘mean reversion’.
Mean reversion is one of the most important concepts in energy and commodity market modelling because many price processes exhibit a natural tendency to move back towards longer-term equilibrium levels. Rather than assuming prices follow a continuous random walk, many valuation and risk models incorporate a mechanism that allows prices to fluctuate while also recognising that extreme prices often become increasingly difficult to sustain.
For this reason, mean reversion forms the foundation of many simulation models used for valuing physical assets, structured contracts, and energy options.
Definition
Mean reversion is the tendency for prices to move back towards a long-term average level at a speed given by a mean reversion rate.
The concept does not imply that prices remain close to the average at all times. Instead, it recognises that:
- prices may deviate significantly from typical levels;
- large deviations often become progressively less sustainable over time; and
- market forces frequently act to pull prices back towards more normal conditions.
In quantitative energy models, this behaviour is represented mathematically by including a mean-reverting component that influences how simulated prices evolve through time.
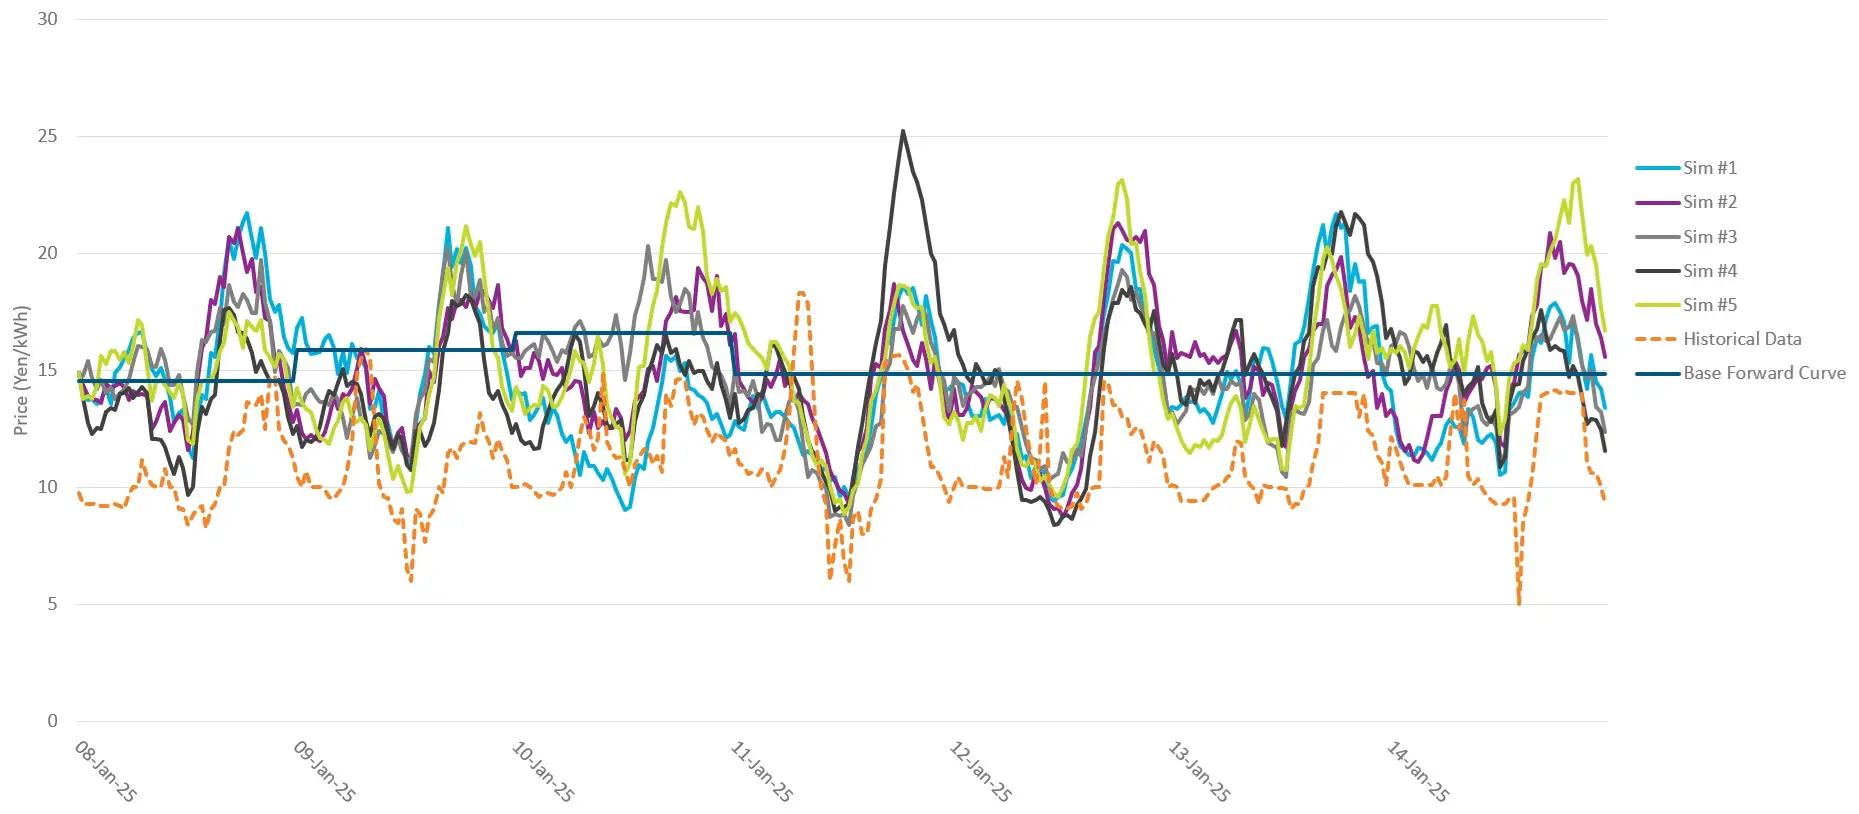
Why Do Energy Prices Tend to Mean Revert?
Unlike many financial assets, energy commodities are closely linked to physical production, consumption, and infrastructure.
When prices become unusually high, market participants often respond by:
- increasing production;
- reducing consumption;
- switching fuels where possible;
- increasing imports; or
- drawing upon storage.
Conversely, when prices fall to unusually low levels, some production may become uneconomic while lower prices encourage additional demand.
Together, these market responses help move prices back towards more typical levels over time.
Mean reversion does not imply that prices return smoothly or at a constant rate. Some market shocks reverse rapidly, for example, short-lived electricity price spikes caused by temporary demand or supply imbalances, while broader structural changes may influence prices over much longer periods. The key idea is that, while prices may deviate significantly for a period of time, market forces often act to pull them back towards an underlying equilibrium.
This behaviour is one of the reasons mean-reverting models are often considered more realistic than models that assume prices simply wander indefinitely.
Mean Reversion Does Not Eliminate Volatility
A common misunderstanding is that mean reversion produces smooth or predictable prices.
It does not. Energy prices can still experience:
- sudden spikes;
- prolonged rallies;
- sustained downturns;
- seasonal movements; and
- unexpected market shocks.
Mean reversion simply introduces a tendency for these deviations to become progressively less persistent over time.
The market remains uncertain, mean reversion merely recognises that extreme prices often become increasingly difficult to sustain indefinitely.
Two Parameters Drive Mean Reversion
Although the mathematics behind mean-reverting price models can become sophisticated, their behaviour is largely determined by just two questions:
- What level are prices tending towards? (long-term mean)
- How quickly do they move back after a market shock? (mean reversion rate)
The answers to these two questions define how the simulated price process evolves over time.
The Long-Term Mean
The long-term mean represents the level towards which prices tend to move over time. Importantly, this should not be viewed as a fixed historical average.
In modern energy models, the long-term mean is frequently allowed to vary through time so that the model remains consistent with today’s forward curve.
This enables simulations to reflect both current market expectations and seasonal pricing patterns while still exhibiting realistic mean-reverting behaviour.
The Mean Reversion Rate
The mean reversion rate determines how strongly prices are pulled back towards the long-term mean. When prices remain close to the mean, this effect is relatively small. As prices move further away, the restoring force becomes progressively stronger.
A higher mean reversion rate causes prices to return more quickly after market shocks.
A lower rate allows prices to remain elevated or depressed for longer periods before gradually returning towards typical market levels.
One practical way practitioners often describe this behaviour is through the concept of half-life – the approximate time it takes for half of a price deviation to disappear.
Half-life provides an intuitive way to understand how persistent price shocks are expected to be and is commonly considered when selecting simulation time steps.
Mean Reversion and Forward Volatility
One of the most useful practical consequences of mean reversion is how it influences uncertainty across different time horizons.
Short-term prices are generally more volatile because unexpected events (such as weather changes, plant outages, or transmission constraints) can have a significant immediate impact.
Over longer periods, however, the effect of individual shocks tends to diminish as prices gradually revert towards more typical market conditions.
As a result, uncertainty often grows more slowly than it would under models that assume prices drift freely without any tendency to return.
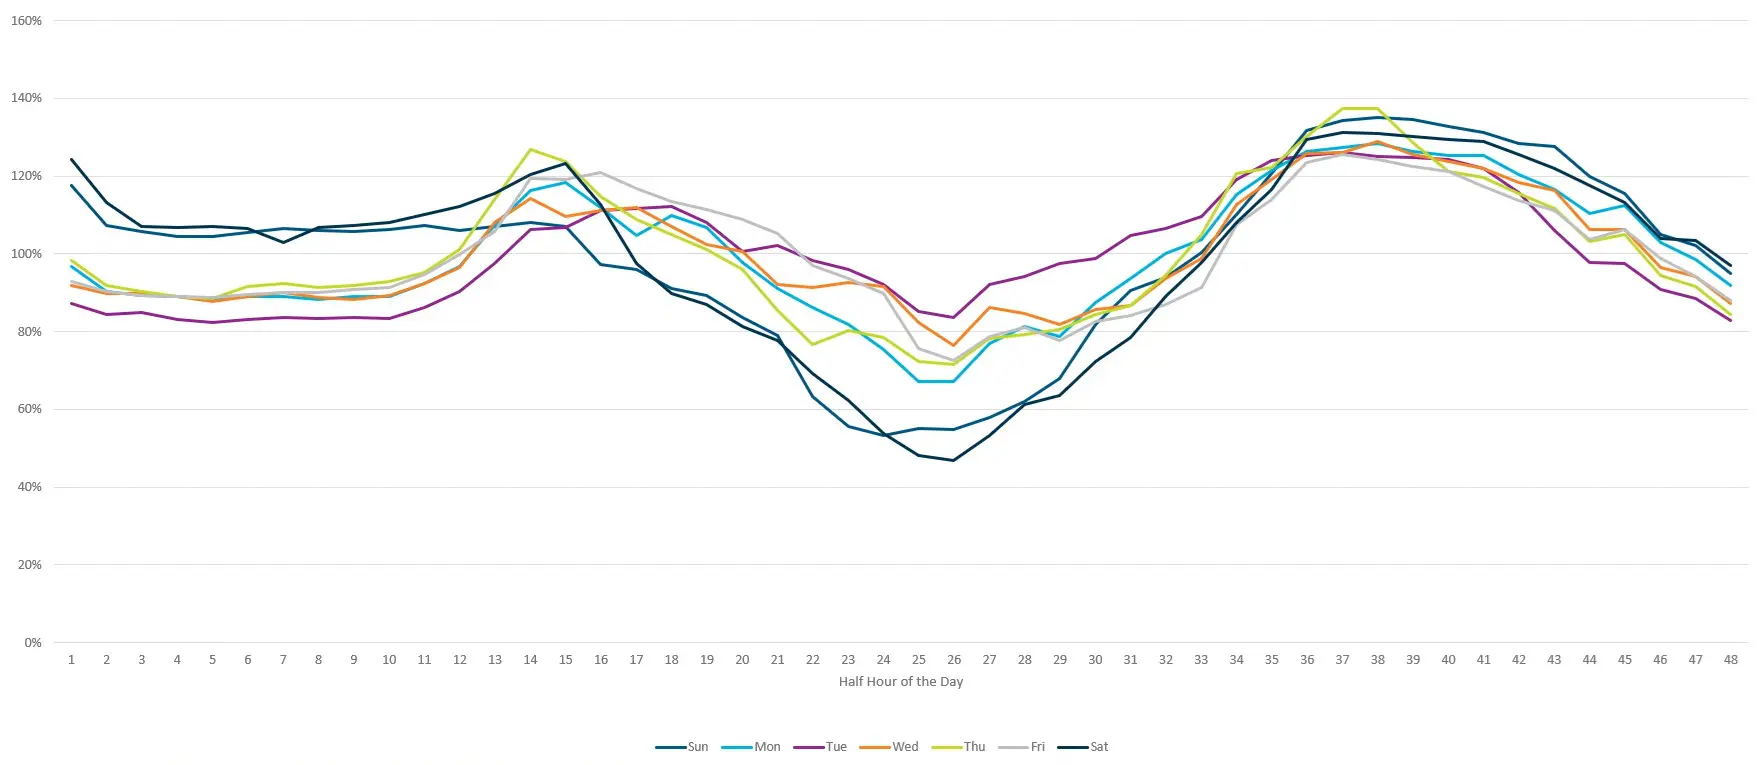
This characteristic makes mean-reverting models particularly well suited to many energy markets, where short-term volatility is high but longer-term prices are generally more stable.
It is also one of the reasons mean reversion is widely incorporated into Monte Carlo simulation models used for energy valuation and risk analysis.
Why Mean Reversion Matters
Mean reversion is not simply an academic concept – it directly affects many of the analytical processes used throughout energy markets.
Models incorporating mean reversion are commonly used to support:
- swing contract analysis;
- physical asset optimisation;
- portfolio risk measurement; and
- long-term scenario analysis.
Without appropriate mean reversion, simulation models may overstate how long price shocks persist, leading to unrealistic price paths and potentially distorting valuation outcomes and risk metrics.
Common Pitfalls and Misconceptions
Mean Reversion Predicts Future Prices
Mean reversion does not predict where prices will move tomorrow. It simply describes one characteristic of how prices tend to evolve over time. Unexpected events can still cause significant and prolonged market movements.
Prices Always Return Quickly
Different commodities exhibit different rates of mean reversion. Some markets recover rapidly aftershocks, while others may remain elevated or depressed for months. Selecting an appropriate reversion speed is therefore an important part of model calibration.
The Long-Term Mean Never Changes
In practical energy modelling, the long-term mean is often allowed to evolve through time so that simulations remain consistent with observable forward market prices and seasonal patterns.
The model therefore reverts towards the current market structure, not necessarily a fixed historical average.
How Mean Reversion Is Applied in Practice
Mean reversion is typically incorporated into stochastic price models rather than being analysed in isolation.
Practitioners first calibrate the model so that it reflects observable market information, including today’s forward curve and relevant volatility assumptions. The calibrated model can then generate realistic future price paths for valuation and risk analysis.
Selecting appropriate mean reversion parameters can become increasingly challenging as organisations expand across multiple commodities, regions, and market regimes. Different markets may exhibit different reversion characteristics, while changing market conditions can require periodic recalibration.
Many organisations therefore use integrated analytics platforms to support model calibration, simulation, and governance. Applications such as Lacima Analytics help ensure mean reversion assumptions remain consistent across valuation, risk management, and portfolio optimisation processes, while providing the transparency and auditability expected within enterprise risk frameworks.
One-Sentence Takeaway
Mean reversion recognises that although energy prices can experience significant short-term volatility, they often exhibit a longer-term tendency to move back towards more typical market levels, making it a fundamental building block of modern energy price modelling.
Related Learning Resources
Learn how stochastic models simulate uncertain future price movements in energy and commodity markets.
How to Perform Monte Carlo simulation in Energy Markets
Discover how mean-reverting price models are used to generate thousands of simulated market outcomes.
What is Volatility Surface Calibration?
Explore how volatility assumptions are calibrated so pricing models remain consistent with observable option markets.
What is a Single-Factor Model?
See how mean reversion forms one of the core building blocks of many single-factor energy price models.