
 Search
Learning | Valuation & Pricing Analytics
What is a Forward Curve?
Introductory Summary
Open almost any energy trading or risk system and one of the first market inputs you’ll encounter is a forward curve.
Forward curves underpin much of modern energy risk management. They provide the market reference used to value contracts, measure exposure, assess hedging strategies, and evaluate physical assets.
Yet despite their central importance, forward curves are often misunderstood as simple forecasts of future prices. In reality, they are something more nuanced: a representation of prices implied by today’s market for delivery at different points in the future. In many respects, it provides the common market language through which future value and exposure are expressed.
Definition
A forward curve is a series of prices representing future delivery of a commodity across a range of dates or delivery periods.
They represent the prices at which the market is currently willing to buy or sell future delivery of a commodity across different dates and delivery periods.
Forward curves are commonly constructed for:
- electricity;
- natural gas;
- crude oil;
- LNG;
- refined products; and
- emissions markets.
They form a critical foundation for valuation, risk management, and commercial decision-making.
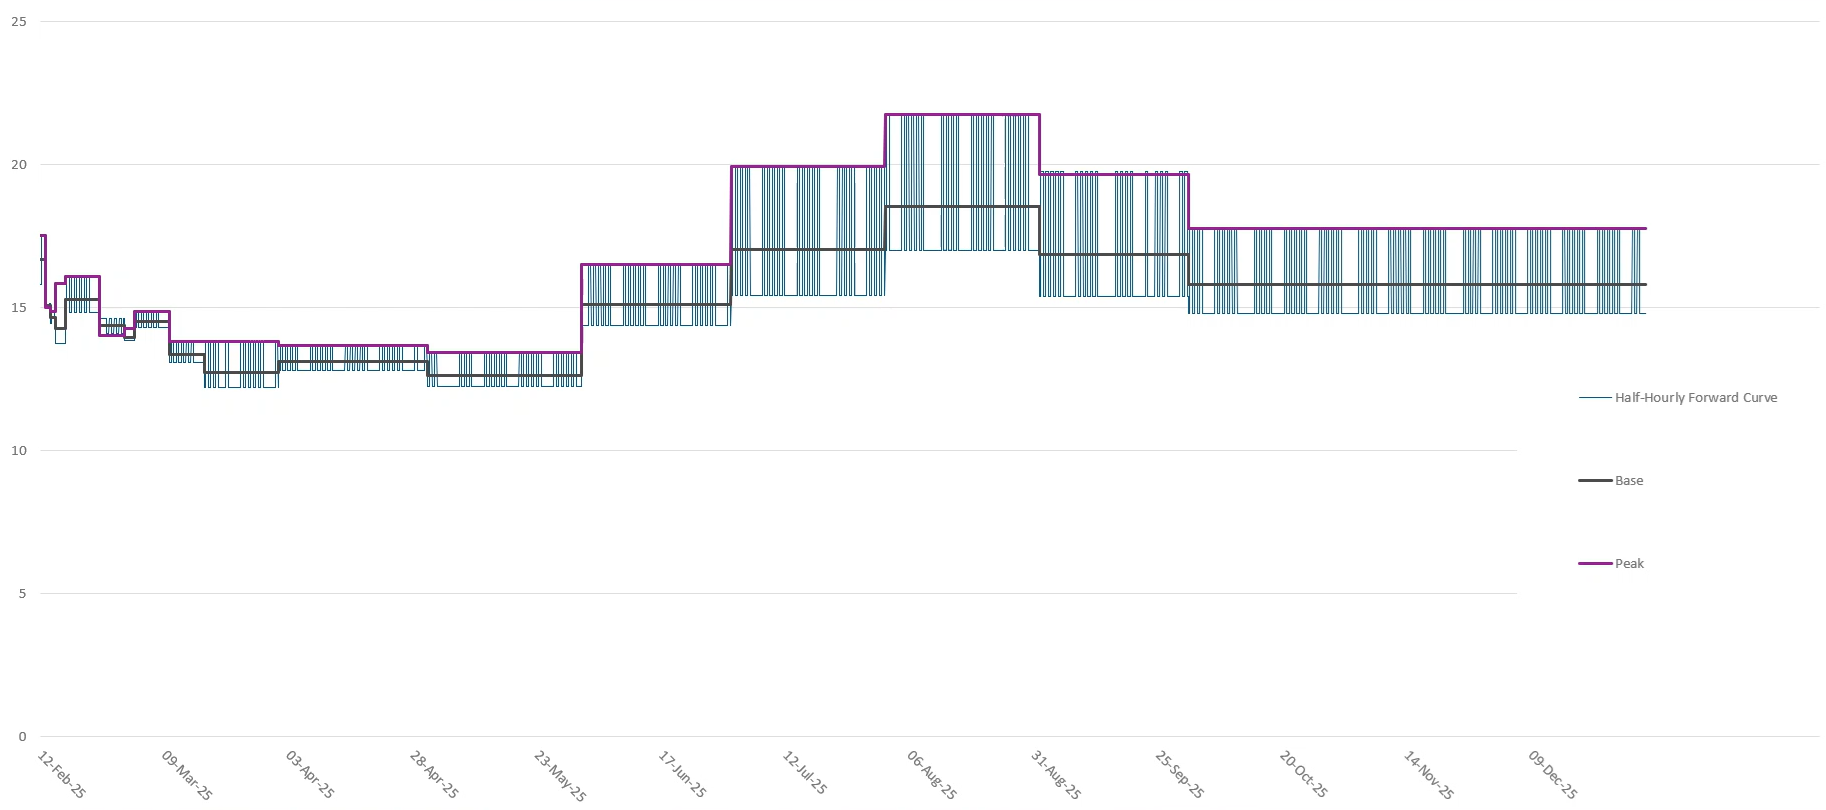
Why Forward Curves Matter
Forward curves provide a consistent market reference point across an organisation. They support activities such as:
- valuing contracts and portfolios;
- measuring Mark-to-Market exposure;
- assessing hedge effectiveness;
- evaluating physical assets;
- performing scenario analysis; and
- supporting commercial planning.
Without a consistent forward curve, different teams can arrive at different answers to the same question. For example, a trader, risk manager, and finance analyst assessing the same gas portfolio should not produce materially different valuations simply because they are relying on different assumptions about future market prices.
Forward curves help create consistency across trading, risk, finance, and commercial functions.
Forward Curves Are Not Forecasts
One of the most persistent misconceptions is that forward curves represent the market’s prediction of future spot prices. They do not.
Forward curves reflect the market conditions that exist today, including current supply and demand dynamics, liquidity conditions, risk preferences, and observable transactions. Actual future prices may differ significantly from the curve.
Understanding this distinction is important because it affects how results should be interpreted:
- A valuation based on a forward curve answers:
“What is this position worth based on today’s market?”
- It does not answer:
“What price will definitely occur in the future?”
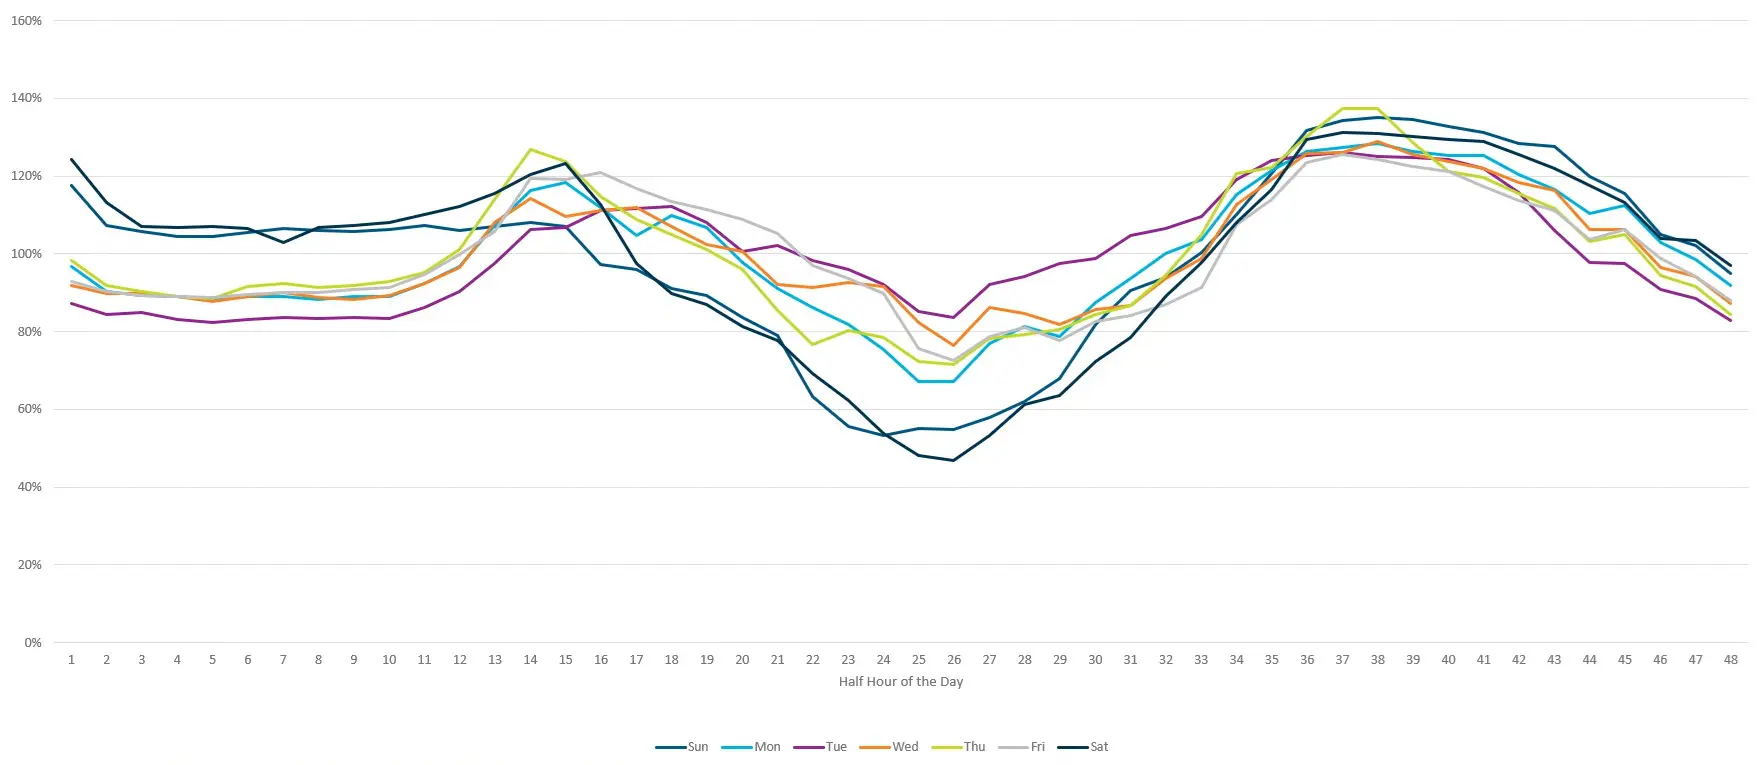
What Influences the Shape of a Forward Curve?
Energy forward curves often exhibit characteristics that reflect the realities of physical markets:
Seasonality
Electricity and gas markets frequently display recurring seasonal patterns driven by weather, consumption behaviour, and operational cycles.
For example, winter gas prices may differ significantly from summer prices due to heating demand and storage requirements.
These recurring seasonal patterns are often incorporated into detailed pricing profiles when practitioners shape forward curves for valuation, simulation, and operational analysis.
Market Liquidity
Some delivery periods trade actively and provide strong observable pricing signals. Further-dated or less frequently traded periods may exhibit lower liquidity and less direct market evidence.
Supply Constraints
Planned maintenance, production disruptions, transportation limitations, and network constraints can influence pricing at specific delivery periods.
These effects can create noticeable changes in the shape of a curve.
Storage Economics
The ability to store a commodity often influences the relationship between near-term and longer-dated prices. Storage costs, inventory levels, and expected future market conditions can all contribute to curve structure.
Common Pitfalls and Misconceptions
Curves Are Only Relevant to Traders
While traders rely heavily on forward curves, they are equally important to:
- risk managers;
- finance teams;
- asset managers;
- commercial analysts; and
- strategic decision-makers.
Many portfolio and investment decisions ultimately depend on the market view represented by the forward curve.
The Curve Is a Prediction
Forward curves are valuation inputs derived from market prices, not forecasts of what will happen. Confusing the two can lead to poor decision-making and misinterpretation of analytical results.
All Points on the Curve Are Equally Observable
Some parts of a curve are supported by highly liquid trading activity, while others may rely on less direct market evidence. Typically nearer dated contracts are a lot more liquid than longer dated contracts hence the price reflected in the market is more reliable. Understanding where liquidity is strongest can help practitioners assess confidence in different portions of the curve.
How Forward Curves Are Managed in Practice
Maintaining consistent forward curves becomes increasingly important as organisations expand across commodities, regions, and time horizons.
Integrated analytics environments help ensure that valuation, exposure measurement, and reporting all draw upon the same market assumptions.
Tools such as Lacima Analytics and Lacima Trader support the management and application of forward curves across complex energy and commodity portfolios.
One-Sentence Takeaway
Forward curves provide the market-based foundation upon which much of energy valuation, risk measurement, and commercial decision-making is built.
Related Learning Resources
How to Build an Energy Forward Curve
Learn the conceptual process used to construct forward curves from observable market data and market conventions.
Discover how completed forward curves are transformed into detailed pricing profiles suitable for valuation and operational analysis.
What is Mark-to-Market (MtM) Valuation?
Explore how forward curves are used to determine the current value of contracts and portfolios.
What is an Energy Trading and Risk Management (ETRM) System?
Understand what ETRM systems do, where their limitations lie, and why organisations complement them with specialist valuation and risk analytics.